
A DevTool makes implicit state visible. Why is this query stale? Which config applies to this file? How did the bundler transform this module? You stop guessing and look.
Modern tools rarely ship without one anymore. TanStack Query and Router, Redux, React Hook Form, Vue and Nuxt DevTools, Vite DevTools, ESLint Config Inspector, the Oxc Inspector... And those are only the ones someone else wrote. Building your own isn't an exotic idea either. Kent C. Dodds was already writing about it years ago, with feature toggles, form autofill and backend switching, all hand-rolled.
So you end up with two families. The DevTools your libraries ship, and the ones your team builds for its own product. Neither knows the other exists. A browser extension here, a floating button injected into your app there, a URL logged in the terminal, a homemade console command for the rest.
Taken one by one, each of these tools improves DevEx. Stacked with no coordination, they do the opposite. You can't see your screen anymore, and you spend more time closing panels than debugging.
This article is about putting all of them in one place, the DevTools you install and the ones you build.
🧰 What a team actually needs
I work on a Platform Frontend team. We look after a large monorepo with several apps, shared packages, a design system, and dozens of developers working in it every day.
That monorepo keeps gaining tools. Every migration brings one in, and each new data-fetching library, router or bundler ships its own DevTools. Good news, until you count them.
When we bring in a tool or a feature, we want it to land with the best DevEx we can give it, not with a README page explaining which snippet to paste in the console. At this scale, every bit of friction gets multiplied by dozens of developers and several apps.
Official DevTools cover the libraries. They don't cover your product. We also wanted panels for an analytics event log, feature flipping shortcuts, the current page layout, and our own state. Until now, we built that plumbing by hand, for every new need, in every app.
So the requirements were short:
- one shared shell for the DevTools we install and the ones we build, instead of five floating panels
- custom panels written as regular components, in each team's framework
- a way to move data across tabs and out to the dev server
- zero cost in production
🔄 The one I tested: TanStack Devtools
TanStack Devtools goes after exactly this. Its docs sum it up in one line: "Build the inspector, not another debugging shell."
It's a framework-agnostic shell that any library or team can plug a panel into. Official DevTools like Query, Router or Form are plugins, and so are yours. Under the hood, there are three layers:
- framework adapters (
@tanstack/react-devtools,@tanstack/vue-devtools...) that expose the API in your framework - the core shell (
@tanstack/devtools), written in Solid.js, whatever your app uses, which handles plugins, tabs, settings and shortcuts - the event system (
@tanstack/devtools-event-client), a typed pub/sub connecting your app to the Vite server over WebSocket or SSE
The plugin workspace tiles several plugins into resizable panels, mini-IDE style. Query, Router and your own panels share the screen instead of fighting over it.
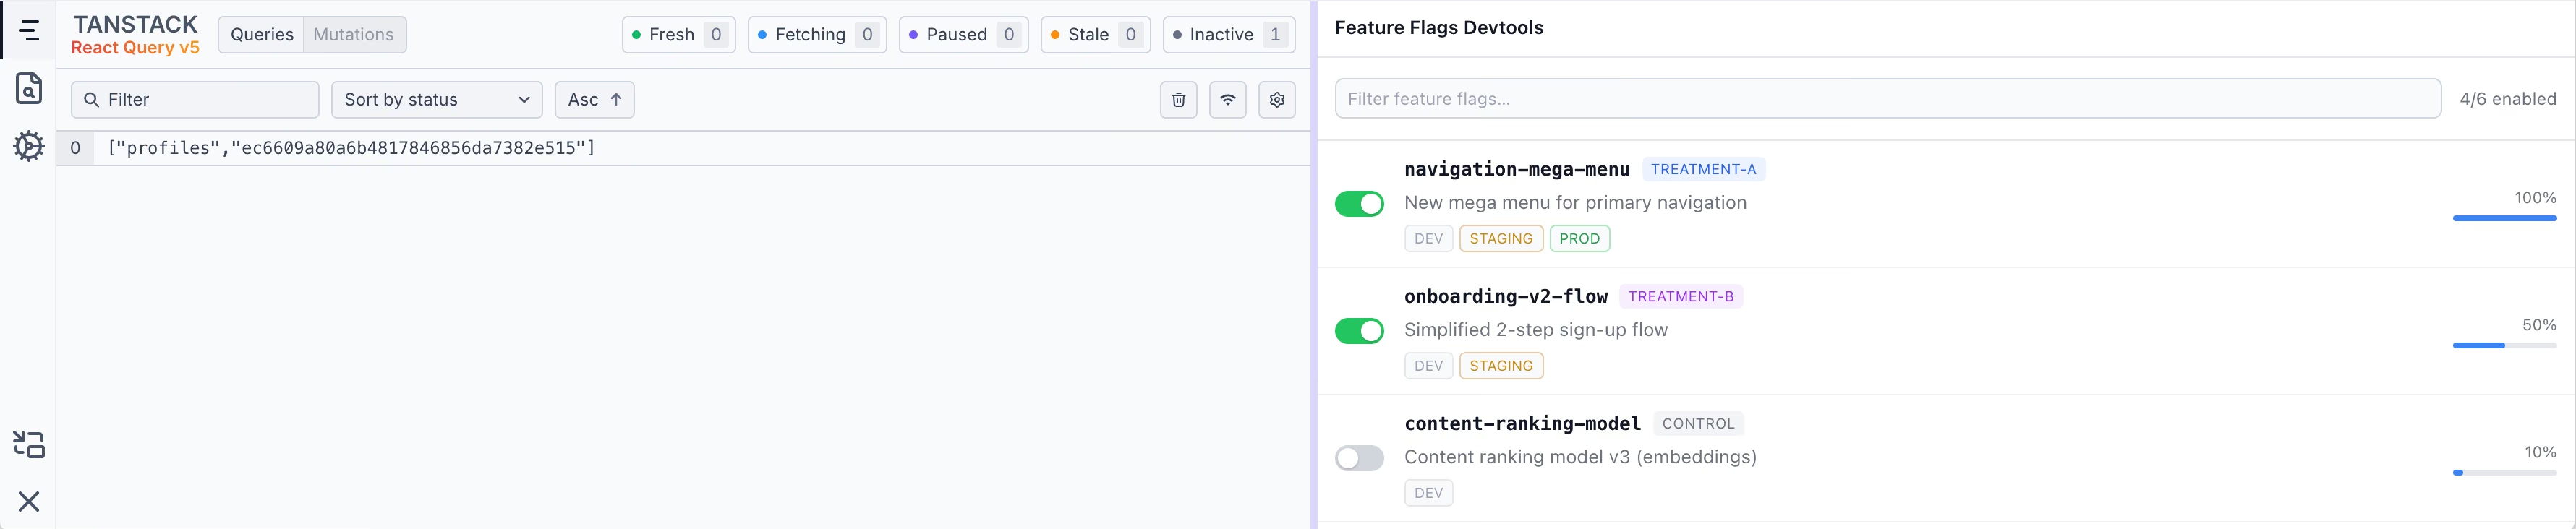
It supports React, Vue, Solid, Svelte, Angular, Preact and vanilla JS. A plugin is a component in your framework, so a React team ships a React component and a Vue team a Vue one, in the same shell.
Zero-cost in production by default. removeDevtoolsOnBuild defaults to true, so DevTools never reach the
production bundle. For your own panels, @tanstack/devtools-utils has createReactPlugin-style factories that return
a no-op twin.
Plugging in your own panel
A custom plugin is a component you pass to the plugins prop:
<TanStackDevtools
  plugins={[
    {
      name: 'Feature Flipping',
      render: <FeatureFlippingPanel />,
    },
  ]}
/>
No class to extend. In our case, FeatureFlippingPanel is a plain React component, but any supported framework works the same way. The only question left is how it talks to your app. There are two ways.
Reading from an existing store
If a store already runs in your app (Redux, Zustand, Jotai...) and the DevTools sit inside its <Provider>, the panel subscribes like any other consumer. That's the easy path. It stops at the tab, though. Anything that has to cross tabs or reach the dev server needs something else.
Going through the event bus
The event bus crosses tabs and reaches the dev server. It's also the only contract a published plugin can rely on, since the plugin can't know the shape of your store. The cost is an emit() at every point you want to see.
import {EventClient} from '@tanstack/devtools-event-client';

type MyEvents = {
  'feature-flag-toggle': {flag: string; enabled: boolean};
};

class TeamEventClient extends EventClient<MyEvents> {
  constructor() {
    super({pluginId: 'team-devtools'});
  }
}

export const teamEventClient = new TeamEventClient();
The panel emits when you toggle a flag. A small module on the app side listens and overrides the real value:
teamEventClient.emit('feature-flag-toggle', {
  flag: 'new-checkout',
  enabled: true,
});
And the app side:
const overrides = {};

teamEventClient.on('feature-flag-toggle', (e) => {
  overrides[e.payload.flag] = e.payload.enabled;
});

function isEnabled(flag) {
  return overrides[flag] ?? realValue(flag);
}emit()s, the app mock on the right on()s. The pattern from earlier, live.Each developer now defines their events and their component, and that's it. The shell handles positioning, shortcuts and persistence for everyone.
One of my favorite features: go to source
This one is a Vite-only feature for now. It comes from the Vite plugin (@tanstack/devtools-vite), which ships a list of built-in features. Of all of them, it's the one I'd miss most.
At build time, it parses your JSX/TSX with oxc-parser and adds a data-tsd-source="file:line:column" attribute to every element. In dev, you hold a shortcut, hover anything on the page, and click. Your editor opens at the right line through launch-editor, the library Vite itself uses, with no configuration.
The click travels over the event bus to the Vite server, which calls launch-editor. Browser to Node, the exact trip a shared store can't make.
I loved it the moment I tried it. And for example, on a big design system, finding the file behind a piece of UI turns into a treasure hunt. For someone new to the codebase, no more grepping a class name to find the component behind a visual bug. You click, you're in the file.
Browser console.log calls get the same treatment, with a clickable file:line, and logs flow both ways between browser and terminal. There's also a plugin marketplace, with an axe-core accessibility overlay and a TanStack AI plugin, and nothing stops a platform team from publishing its own internal plugins.
🌐 What if we went even more generic? Meet Devframe
TanStack Devtools fixes the problem inside your app's page. The same fragmentation exists one level down, in the tools themselves. Every DevTool rebuilds its own RPC, state sync and web UI, wired to one framework's dev server, and the next framework rebuilds it slightly differently.
Devframe tackles that. The idea started with Nuxt DevTools, took shape in Vite DevTools at Vercel, and Devframe hit v1.0 in September 2026. It's a framework for building DevTools, the way Nuxt or Next.js is a framework for building web apps. In the announcement post, Anthony Fu compares its adapter layer to unplugin: bundler plugins get one common interface there, devframes get one common definition across host frameworks.
How can one definition run almost anywhere? Through a boundary every host already speaks. defineDevframe() describes the tool once, with its RPC functions, its state and its UI. initDevframe() turns that into a Web Standard Request to Response handler.
import {defineDevframe} from 'devframe';
import {initDevframe} from 'devframe/initiate';

const myDevframe = defineDevframe({
  id: 'my-tool',
  name: 'My Tool',
  rpc: [getModules],
  view: {type: 'spa', distDir: './dist/client'},
});

const {handler} = initDevframe(myDevframe, {base: '/__my-tool/'});
Hono and Nitro take that handler as is. Next.js and SvelteKit expose route handlers it fits into. Vite and Rsbuild accept the connect-style middleware the same instance provides. The post calls this "almost the entire portability trick". Any of them can mount it. In practice, Vite DevTools is the first host built on it, Nuxt and Vue follow, and the Next.js integration is still an internal prototype.
Beyond the handler, every other entry point is an adapter that repackages the same definition: a standalone CLI, a static report in your CI, an MCP server, a dock in Vite or Nuxt DevTools.
The tool's UI is a regular SPA, in Vue, React, Svelte or Solid. Devframe adds typed RPC and shared state between Node and the browser, over WebSocket or SSE.
Reading the docs felt like reading our requirements list, pushed further. One place for the tools you install and the ones you build, panels in each team's framework, data crossing the browser boundary. It's what TanStack Devtools pushes for, one level lower and without being tied to your app's page.
Built for humans and agents
Then there's the part TanStack Devtools doesn't touch. Devframe is built for humans and for agents. The same function sits behind the button in your panel and behind an MCP tool, so our feature flag toggle becomes something Claude Code can flip itself while it works on the new checkout. Functions stay private unless you expose them, so the agent only gets what you chose to hand over. The announcement even pictures asking an agent for a throwaway devframe, built to answer one question and then dropped.
Already in use
The post splits DevTools into layers, and each one has real examples:
- General capabilities, built once for every host. Accessibility, terminals, a data inspector, MCP.
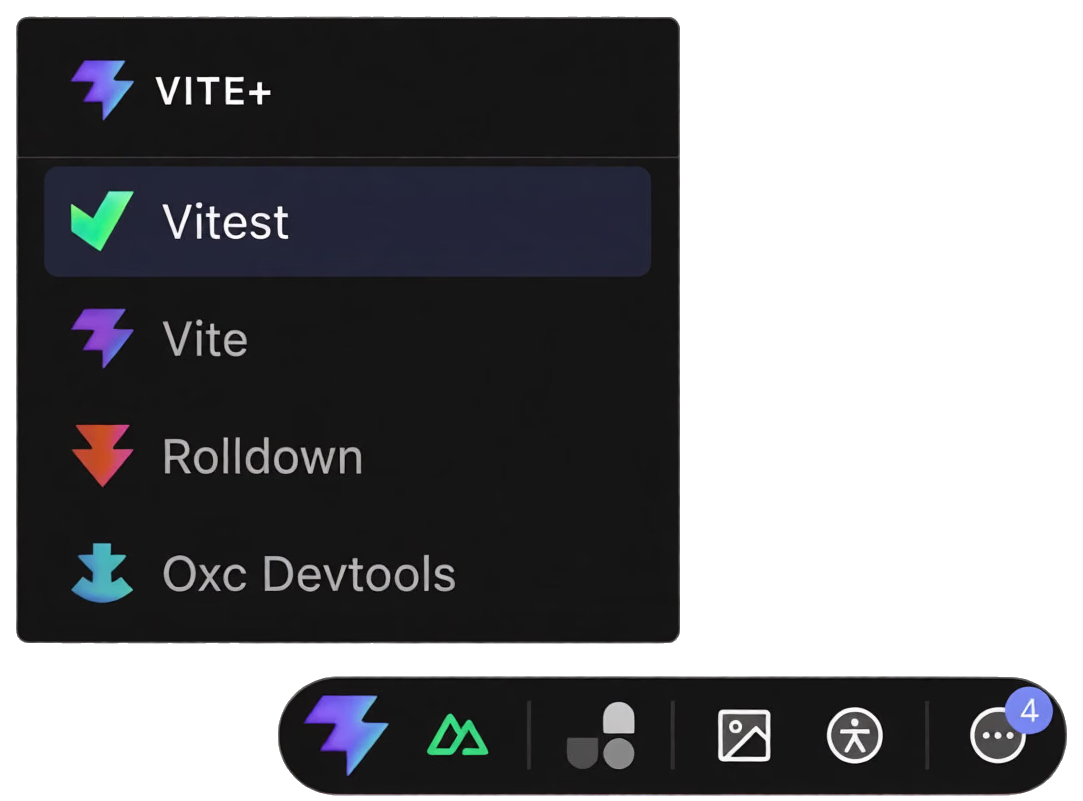
- Build tools. Vitest, Rolldown and Oxc, all in the new Vite DevTools dock.
- Framework-specific panels. Nuxt DevTools v4 builds on Devframe and Vite DevTools, and ships with Nuxt 5. Vue DevTools is moving to Vite DevTools, so it ends up on Devframe too.
- Ecosystem tools. ESLint Config Inspector, UnoCSS Inspector, Node Modules Inspector.
How it fits with TanStack Devtools
Three words keep coming up in the docs, so here's how they fit together:
- A devframe. One tool, like the terminal or the accessibility checker.
- A hub.
@devframes/hubmounts several devframes behind one handler and gives them docks, commands and shared state. It has no UI of its own. - A host. The product built on a hub, with its own UI and its own knowledge of a framework. Vite DevTools is the first one, Nuxt DevTools v4 is next.
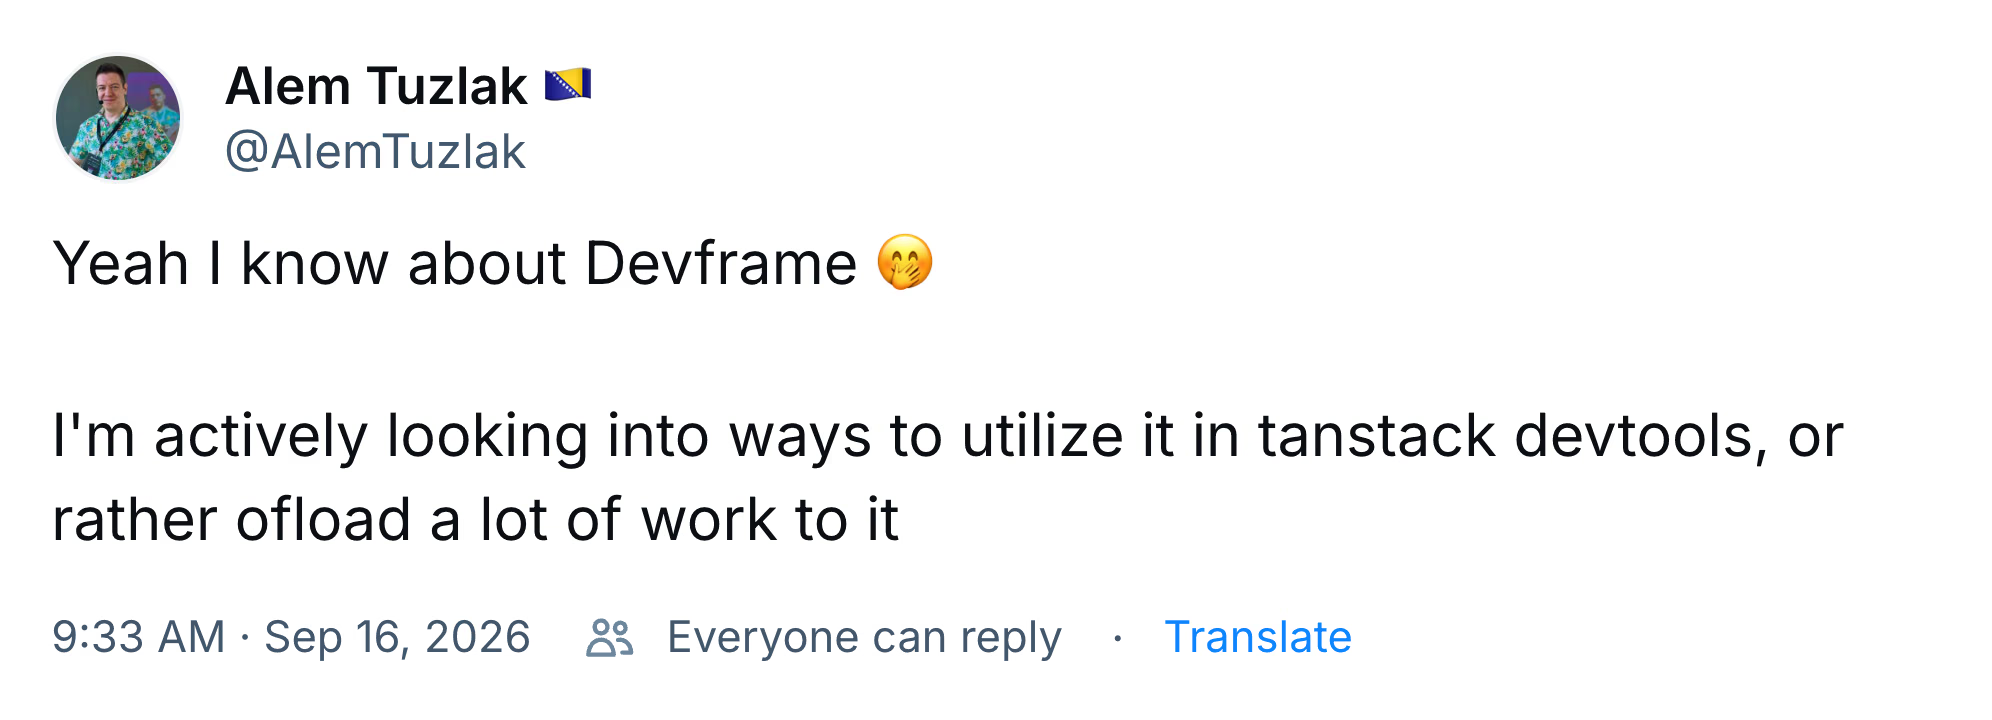
So the two don't compete. In those terms, TanStack Devtools is a host, a shell that lives in your app's page. Devframe is the framework you'd build that kind of host with. They overlap on the plumbing: gathering several tools in one place, and talking to the server. That's the part TanStack could hand over to Devframe while keeping its plugin API. The day Devframe v1.0 came out, Alem Tuzlak, who maintains TanStack Devtools, said as much:
Both are open source, at TanStack/devtools and devframes/devframe.
I won't paraphrase the rest. Nothing explains Devframe better than its announcement post, so read it, then try it. That's what I'm doing next. Our feature flag panel, rebuilt as a devframe, might well turn into a future article.
🚀 What actually changes
This piece of DevEx used to be built by hand, or not at all. We lived with the friction and the longer onboarding and called it the price to pay. TanStack Devtools makes it cheap inside your app. Devframe takes the same idea across every host, and hands your tools to your agent too.
The Devframe post says a good tool should be built once, travel further, and get better as more people contribute. That holds for the ecosystem, and it holds for a monorepo with dozens of developers. Build it once, give it to every team, and close those five floating panels for good.
A lack of DevEx never shows, until the day you fix it. Your teams deserve DevTools.